SZ.300203

Near-infrared technology is a nondestructive, rapid and green analysis technology, and can be applied to the determination of oil and grease product as well as oil seeds quality in oil factories. The technology has brought huge economical benefits to factories. SupNIR-2700 analyzer, based on near-infrared reflectance spectroscopy, performs well and possesses outstanding software integrated with the functions of spectra acquisition, modeling, remote control and management. The analyzer was successfully used to determinate contents of the moisture, protein, fat and amino acids in the soybean and soybean meal. The results show that predicted values for near-infrared method are correspondingly near to reference values for national standard methods and the near-infrared analyzer can meet the requirement of quality control for oil and fat products as well as oil seeds.
Near-infrared light is defined by ASTM as electromagnetic waves with wavelength in the range of 780-2526 nm. The near-infrared spectroscopy is mainly caused by the frequency doubling and frequency combination of the hydrogen-containing groups in the organic molecules. Different groups have their characteristic absorption peaks, and their strengths vary with the content of the sample composition, which forms the basis of qualitative and quantitative analysis of near-infrared.
Near-infrared spectroscopy has become the fastest and most compelling spectral analysis technology in recent years. Because of its fast analysis speed, no need for pretreatment and high efficiency, it has been widely used. Near-infrared spectroscopy initiated in the agricultural field. At present, large enterprises in the feed, grain and oil industries use this technology to manage all the quality control links from raw materials to products, which can bring considerable economic benefits to enterprises. In this paper, the application of near-infrared technology in soybean and soybean meal quality was studied on SupNIR-2700 near-infrared analyzer, and the amino acid analysis curve of soybean meal was established.
The 415 samples of soybeans collected for the experiment came from all over the world. All samples were cleaned and packed in plastic sealed pockets and stored in a 4°C freezer.
The sample moisture was dried by GW-1AT electric blast drying oven, the crude protein was analyzed by KDN-04A semi-automatic Kjeldahl azotometer, the crude fat was extracted by Soxhlet extractor; the amino acid was detected by S-433D automatic amino acid analyzer (Secam, Germany); the electronic balance model was FA2104S.
A database is established by aligning the sample spectrum with the reference value obtained by the national standard detection. In order to eliminate the influence of baseline drift and sample particle size difference on the spectrum, each sample spectrum was pretreated with Savitzky-Golay smoothing, first order reciprocal and multiple scattering correction (MSC). The pre-treated sample spectrum is correlated with its corresponding characters. The model is established by partial least squares (PLS) method. The 80% sample forms a calibration set to establish a model, and the remaining 20% sample forms a testing set to test the model to determine the final result.
Table 1 shows the model results for some characters of soybean and soybean meal, such as moisture, crude protein, crude fat and amino acid content. Figure 1 and Figure 2 show the related curve between the reference value and the near-infrared predicted value of the soybean and soybean meal.
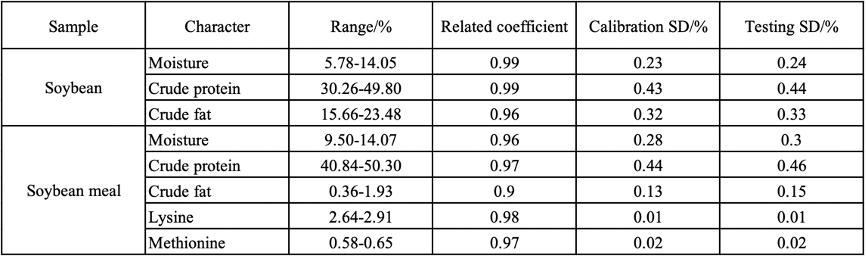
Tab.1 NIR Model Parameters of Soybean and Soybean Meal
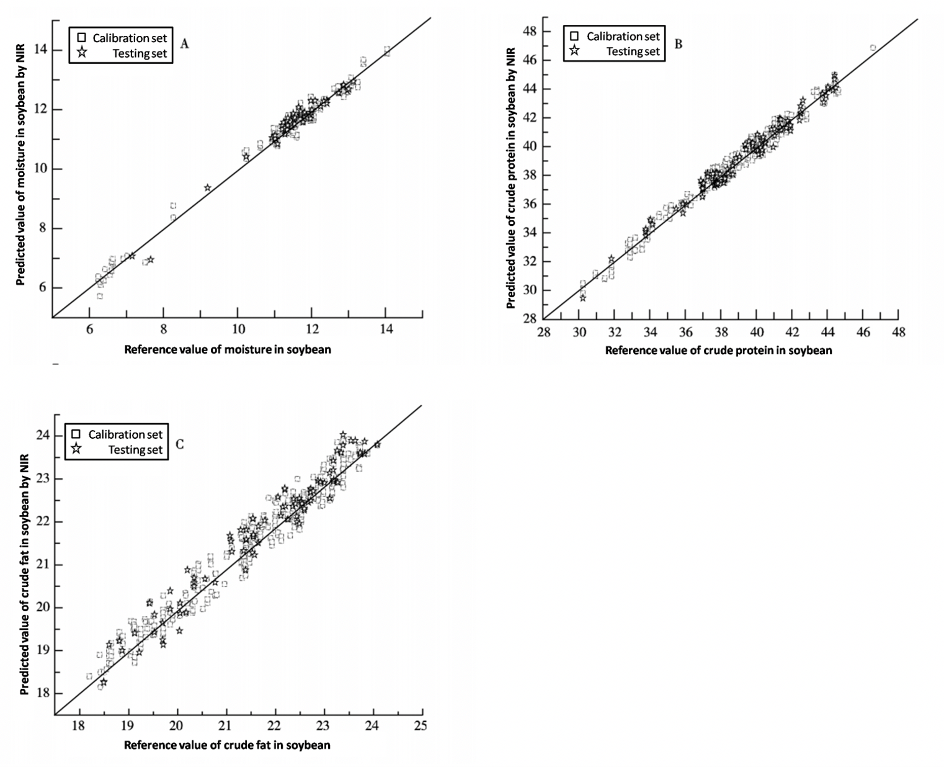
Fig.1 Related curve between reference value and NIR predicted value for soybean moisture (A), crude protein (B) and crude fat (C)
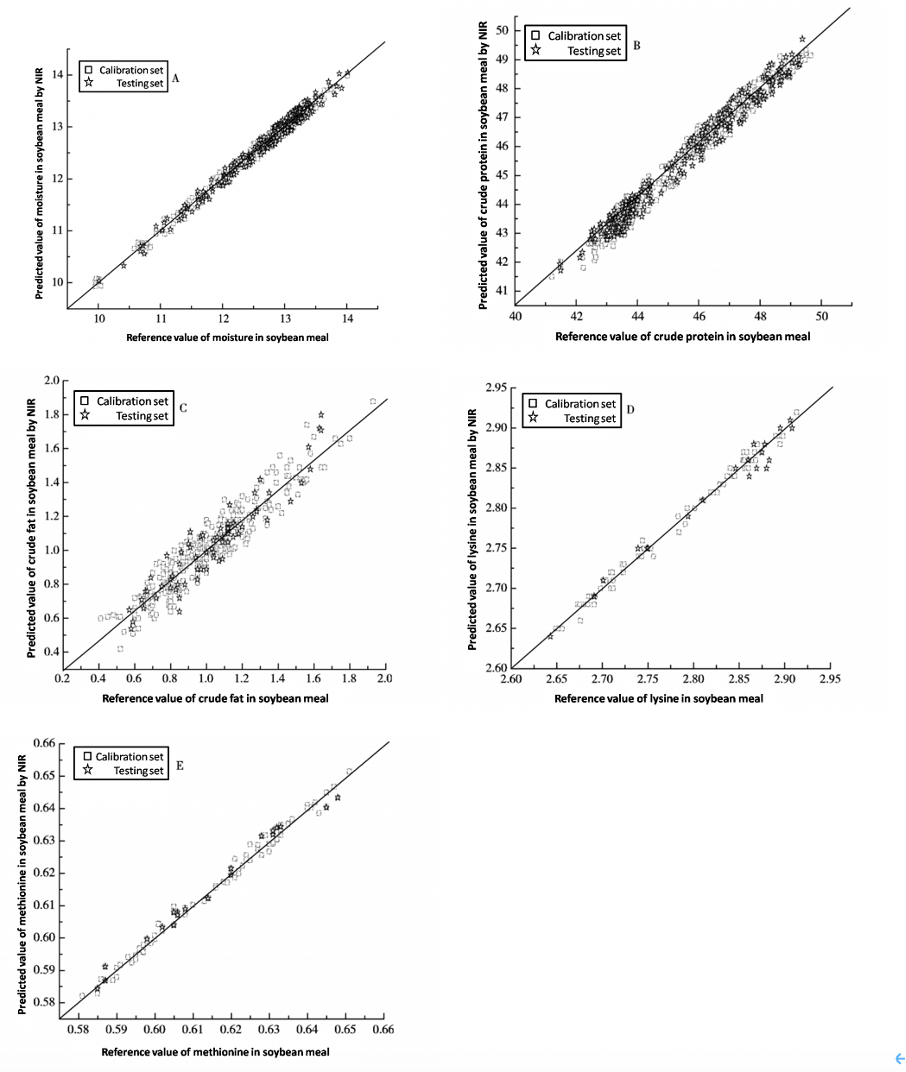
Fig.2 Related Curve Between Reference Value and NIR Predicted Value for
Soybean Meal Moisture (A), Crude Protein (B), Crude Fat (C), Lysine (D) and Methionine (E)
It can be concluded from Table 1, Figure 1 and Figure 2 that the test values obtained by near-infrared analysis have a good correlation with the reference values of the national standard analysis method. It can be seen from Table 1 that the standard deviation of the accuracy of the near-infrared detected moisture index is about 0.25%, the standard deviation of the detected crude protein is about 0.45%, the standard deviation of the accuracy of the detected crude fat is about 0.35%.
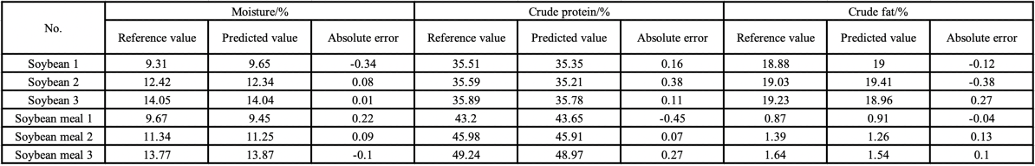
Tab.2 Predicted Value of Soybean and Soybean Meal by NIR Analysis
Table 2 shows the absolute error analysis results of the near-infrared predicted value and the reference value of some test samples. It can be seen that the absolute error of moisture of most test samples is less than 0.2%; the absolute error of crude protein is less than 0.4%; the absolute error of crude fat is mostly less than 0.3%. The above results show that the SupNIR-2700 NIR analyzer has good accuracy.
3. Conclusion
Soybean and soybean meal were analyzed by the near-infrared analyzer (SupNIR-2700) independently developed by FPI. The predicted results were comparable to the reference values, which can meet the requirements of rapid quality inspection. It also shows that the near-infrared analyzer has a good application prospect in the field of grain and oil processing.
Related Products:
SupNIR-2700 Near Infra-red Analyzer
//sen5.com/en/product_cont_8252.html